Corporate Minimal Impact Report
What if impact reporting didn’t require dense jargon, 80-page appendices, or a team of analysts just to be legible? The Corporate Minimal Impact Report reimagines accountability—not as a compliance chore, but as a strategic communication tool. It’s built on the principle that clarity is itself a form of responsibility. When stakeholders—investors, employees, customers, community partners—can absorb your impact story in under five minutes, you’ve already achieved more than most annual reports ever do.
This isn’t about cutting corners. It’s about cutting noise. The Corporate Minimal Impact Report delivers rigor without redundancy, insight without inflation. Its strength lies in structure: a lean, intentional framework grounded in evidence, designed for real-world use—not shelf display.
A Framework That Serves Purpose, Not Protocol
Unlike traditional sustainability or ESG disclosures—which often prioritize completeness over comprehension—the Corporate Minimal Impact Report starts with audience intent. Who needs to know what—and why? A startup founder sharing progress with early backers doesn’t need the same depth as a multinational preparing for regulatory review. This template meets both with equal fidelity, because its architecture is modular, not monolithic.
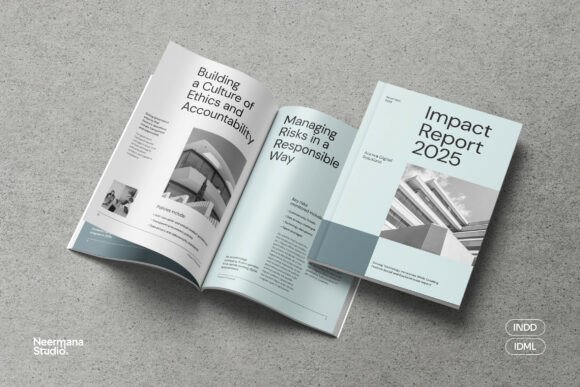
The ECG Impact Report template—designed specifically for this approach—provides 16 unique, print-ready pages anchored by a master page. Every section has purpose: the Executive Summary distills *what changed*, not just what was measured; the Background grounds the report in context, not corporate history; Methodology clarifies *how* data was gathered and validated—not just listing tools. There’s no room for vague claims like “we’re committed to sustainability.” Instead, there’s space for “We reduced Scope 1 & 2 emissions by 27% YoY, verified via third-party audit—here’s how.”
Creative Flexibility, Not Visual Compromise
Minimal doesn’t mean minimal effort—it means maximal intention. The template includes drag-and-drop image placeholders, INDD and IDML files, and a fully documented help file listing all fonts (100% free and license-safe). Typography is balanced, hierarchy is clear, and whitespace is used deliberately—not as absence, but as emphasis. Charts and infographics aren’t decorative extras; they’re integrated narrative devices. A single bar chart comparing baseline vs. current water usage can communicate more than three paragraphs of explanation.
Designers and marketers especially appreciate how easily it adapts: swap color palettes to match brand guidelines, adjust spacing for digital PDFs versus printed stakeholder decks, embed QR codes linking to raw datasets or video explainers. One NGO resized the layout for a bilingual version—Spanish and English side-by-side on facing pages—without disrupting flow. A cleantech startup layered subtle animated transitions into the digital version for investor pitch meetings, keeping the static print file pristine.
Real Applications Across Real Roles
For consultants: Use the template as a client-facing deliverable—not just analysis, but translation. Frame findings through the lens of operational leverage: “Your 15% reduction in packaging waste translates to $210K in annual logistics savings *and* lifts brand trust scores by 12 points among eco-conscious buyers.” Anchor every insight in actionability.
For educators and trainers: Assign students to complete a mock Corporate Minimal Impact Report for a local business—using publicly available data, interviews, or even observational fieldwork. The structure teaches critical thinking: What metrics matter most? How do you define “impact” for a café versus a software firm? Where does storytelling end and evidence begin?
For startups and small teams: You don’t need a dedicated ESG officer to start. Begin with one metric that aligns with your mission—e.g., carbon per unit shipped, % of diverse suppliers, or hours of employee pro-bono work—and build outward. The template’s clean layout prevents scope creep; its consistent headings keep focus tight. One freelance design studio used it to showcase their shift to 100% renewable energy hosting—paired with a simple line graph showing server load vs. grid carbon intensity. Clients responded with tangible new project inquiries.
For NGOs and advocacy groups: Flip the lens. Use the same framework to assess *partner organizations*—not for judgment, but for collaborative learning. “Here’s how your procurement policy compares to sector benchmarks,” or “Your community engagement model shows strong qualitative outcomes—let’s identify scalable levers.” Clarity builds credibility; consistency builds trust.
Keeping It Clear, Consistent, and Human
Three practical habits separate effective minimal reporting from superficial simplification:
- Lead with the insight, not the input. Don’t open with “We surveyed 327 employees.” Open with “74% of staff report stronger alignment with company values since leadership training launched—especially in hybrid roles.”
- Use plain language—even when describing complex systems. Replace “leveraged synergistic cross-functional alignment” with “marketing and operations teams co-designed the new recycling workflow together.”
- Anchor numbers in meaning. “$48K saved” becomes “Enough to fund two full-time internships—or offset 1,200 tons of CO₂.”
Consistency isn’t about rigid repetition—it’s about predictable logic. If Page 3 defines “minimal impact” as “measurable change with lowest feasible resource cost,” then Page 9’s recommendations must reflect that definition. The master page ensures visual continuity; the structured headings ensure cognitive continuity.
Why This Approach Endures
In an era of information overload and attention scarcity, the Corporate Minimal Impact Report answers a quiet but urgent need: to be understood. Not admired. Not filed away. Understood. It respects the reader’s time, intelligence, and intent. It assumes stakeholders want to engage—not decode.
That respect is where authority begins. When your report makes complexity feel navigable, when your data feels grounded and your conclusions feel earned, you’re not just sharing results—you’re building shared understanding. And that’s the foundation of real influence, real collaboration, and real progress.
Whether you’re drafting your first impact summary or refining your tenth, the power isn’t in adding more—it’s in choosing what stays, what speaks, and what serves.